Local Version Control for Block Designs in Vivado
Creating reproducible block designs in Vivado
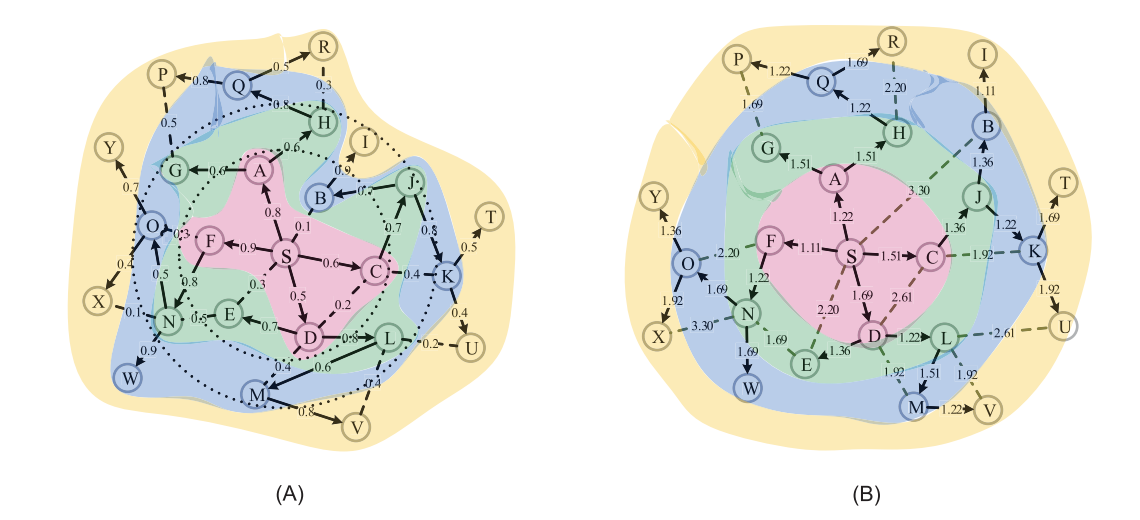
I started reading a review recently about source detection of rumors in a social network to start to get a better idea of a project that I’m planning on working on in the near future.
There were mainly three models mentioned
1. Degree centrality:
Also known as the indegree of a node.
2. Closeness centrality:
Defined as the average shortest distance between a node and other nodes. This was introduced in a classic paper by Linton Freeman 1 and also referred to as the “independence” of a point. Linton mentions that a previous version of centrality measured by Sabidussi (1966) is actually inversely related to centrality.
\[d(p_{i}, p_{k}) = \text{the number of edges in the geodesic linking }p_{i}\text{ and }p_{k}\]
Sabidussi’s measure of the decentrality of a point \(p_{k}\) is:
\[C_{c}(p_{k})^{-1} = \sum_{i=1}^{n}d(p_{i}, p_{k})\]
3. Betweenness centrality:
Nodes that appear in the shortest paths. The cited papers are fairly recent (2002, 2011, 2014)
4. Jordan centrality:
Also known as the center of a graph. This is related to the idea of closeness centrality using the Sabidussi measure. Node with smallest max distance to contaminated and recovered nodes. The number of Jordan centers is equivalent to the radius of a graph. 2

5. Eigenvector centrality:
Sum of degree centrality of neighbor nodes. It’s worth remembering that since the adjacency matrix of an undirected simple graph is symmetric, it has a complete set of real eigenvalues and an orthogonal eigenvector basis. We take the largest eigenvalue here which is bounded above by the maximum degree. 3
1. Network partitioning:
2. Ranking based:
This introduces an interesting idea of reverse flow. 5 In the Independent cascade model, active nodes have probability \(p\) to turn adjacent nodes into active nodes as well. Hence, a forward flow has probability \(1-p\) to stop at a current node. If we run the flow backwards from every node in multiple simulations, we can find nodes that are hit frequently by reverse flow, which are more likely to be attackers.
3. Community based:
This paper introduces the idea of partitioning a graph into communities via reverse propagation.6 The paper claims that the leading eigenvector method takes advantage of a benefit function called \(modularity\).
The paper suggests maximizing this function with indicate better divisions. It mentions exhaustive maximization over all possible divisions, but I wonder if we could just use sparse cut algorithms.
4. Approximation based: This paper introduces the idea of a set resolving set (SRS) which is the smallest subset such that can identify infection sources without knowledge of the number of source nodes. The algorithm is a polynomial time greedy algorithm.
I particularly was interested in the idea of the reverse flow and stochastic algorithms for approximating the source nodes for epidemic/rumor diffusion. It appears to be an open problem to determine the number of sources in any network. While some of the defining measures of centrality within a graph were defined in the 1950s, there are also a lot of recent methods addressing approximating sources with more compute power, especially in light of COVID tracking in the past two years.
Freeman, Linton C. “Centrality in Social Networks Conceptual Clarification.” Social Networks 1, no. 3 (January 1, 1978): 215–39. https://doi.org/10.1016/0378-8733(78)90021-7. ↩
https://mathworld.wolfram.com/GraphCenter.html ↩
https://en.wikipedia.org/wiki/Adjacency_matrix ↩
Paluch, Robert, Xiaoyan Lu, Krzysztof Suchecki, Bolesław K. Szymański, and Janusz A. Hołyst. “Fast and Accurate Detection of Spread Source in Large Complex Networks.” Scientific Reports 8, no. 1 (February 6, 2018): 2508. https://doi.org/10.1038/s41598-018-20546-3. ↩
Nguyen, Dung T., Nam P. Nguyen, and My T. Thai. “Sources of Misinformation in Online Social Networks: Who to Suspect?” In MILCOM 2012 - 2012 IEEE Military Communications Conference, 1–6, 2012. https://doi.org/10.1109/MILCOM.2012.6415780.\ ↩
Zang, Wenyu, Peng Zhang, Chuan Zhou, and Li Guo. “Discovering Multiple Diffusion Source Nodes in Social Networks.” Procedia Computer Science, 2014 International Conference on Computational Science, 29 (January 1, 2014): 443–52. https://doi.org/10.1016/j.procs.2014.05.040. ↩
Creating reproducible block designs in Vivado
Learning about the architecture of model focused on a spatio-temporal graph convolutional neural network.
Comparing the pros and cons of different models evaluated by various centrality measures and evaluation metrics.